Several projects at Southern Illinois University support nutrient loss reduction in Illinois. In 2025, some projects were funded by Illinois Nutrient Research & Education Council, NREC, and more information can be found at illinoisnrec.org or by reaching out to the Willard Schoonover Laboratory at SIU. NREC-funded projects in 2025 included:
- Assessing Water and Sediment Control Basins, WASCoBs, on Trapping Sediment and Nutrients in Southern Illinois: Influence on Water Quality
- The Implementation of Innovative Practices for Dry Dams/WASCoBs to Address Water Quality Concerns in Southern Illinois Row-Crop Agriculture
Utilizing Runoff Management Zone Systems to Address Concentrated Flow Paths
Another project, not funded by NREC, took place in 2025 called Utilizing Runoff Management Zone Systems to Address Concentrated Flow Paths and their Effects on Water Quality, Soil Loss, and Agricultural Productivity. In southern Illinois, agricultural runoff is dominated by overland flow, making the mitigation of concentrated flow path, CFP, formation with best management practices, BMPs, essential to preventing yield loss, sediment transport, and nutrient loss at field edges. Farmers incur a range of financial and environmental costs depending on the CFP management strategies they adopt, and the absence of BMPs, or improper maintenance, accelerates soil loss and impedes field accessibility. Frequent tillage repairs act as annual maintenance, increase field entry, and redistribute soil in ways that reduce yields, while nutrient- and sediment-laden runoff threatens nearby waterways. Current BMPs tend to be reactive and may not adequately address the spatial extent of CFPs across agricultural fields.
In 2025, five agricultural fields managed in a corn-soybean rotation on the Southern Illinois University Research Farm were scouted to identify and characterize dynamics of unmanaged CFPs. The selected fields ranged from 27 to 68 acres and 15 total CFPs were identified. The CFPs were divided into three size categories based on drainage area, small (0.5-4.1 ac), medium (4.1-8.0 ac), and large (8.0-14.0 ac) (Fig. 1). Preliminary field surveys were conducted to measure the length, width, and depth of CFPs. These in-field measurements were used to establish baseline soil loss rates (tons per acre per year) for each CFP, presented in Table 1. Preliminary results showed that these areas can lose substantial amounts of soil, with erosion ranging from less than 0.1 to more than 3 tons per acre per year. Soil in the upper portions of the flow paths was more compacted than at the outlets, while soil texture was generally similar across the sites. Yield maps showed lower soybean yields within and around concentrated flow paths, highlighting their impact on crop productivity. The findings will help guide better management practices to reduce erosion, protect water quality, and improve farm profitability.
Figure 1. Map showing the location of 15 drainage areas containing identified concentrated flow paths.
Table 1. Preliminary soil loss data in tons per acre per year from each CFP based on watershed areas.
CFP | Watershed Area (ac) | Soil loss/CFP (tons) | Tons/acre/yr |
1 | 0.53 | 0.05 | 0.09 |
2 | 1.11 | 3.09 | 2.78 |
3 | 2.2 | 4.84 | 2.2 |
4 | 3.93 | - | - |
5 | 4.06 | 8.07 | 2.05 |
6 | 4.4 | 13.7 | 3.11 |
7 | 4.53 | 6.54 | 1.44 |
8 | 4.59 | 6.77 | 1.48 |
9 | 4.94 | 16.95 | 3.43 |
10 | 7.78 | 15.1 | 1.94 |
11 | 8.01 | 2.57 | 0.32 |
12 | 9.71 | 13.7 | 1.41 |
13 | 10.86 | 6.26 | 0.58 |
14 | 12.72 | 4.38 | 0.34 |
15 | 13.71 | 22.8 | 1.66 |
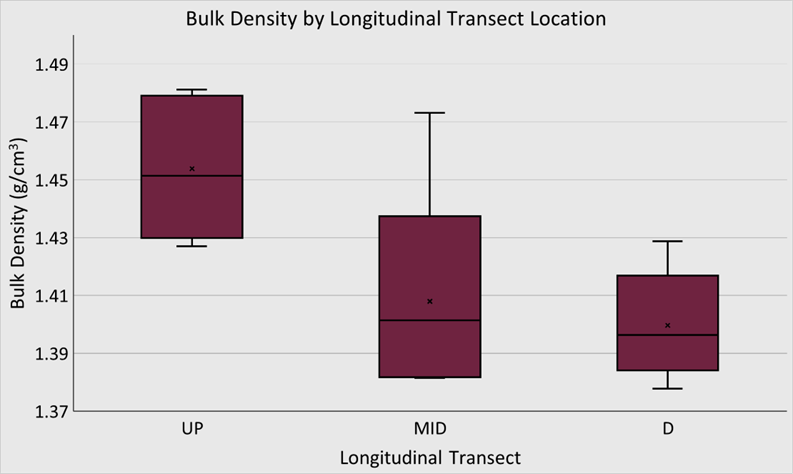
Initial soil physical properties of bulk density and texture were analyzed in 2025. Sampling was conducted along longitudinal and cross sectional transects within each CFP watershed to evaluate changes in soil properties from the upper portion to the outlet (Fig. 2). Preliminary bulk density values are significantly higher in upper portions of CFPs when compared to bulk density at CFP outlet (Fig. 3). There were no significant differences in soil texture along either longitudinal or cross sectional transects of CFPs. A textural change observed in CFP 5 is a clay percentage of over 28, making it a silty clay loam rather than the mapped silt loam expected in the field. Baseline soil properties from five CFPs are presented in Table 2.
Figure 2. Soil sampling locations in concentrated flow path showing longitudinal (UP = upper portion, MID = middle portion, D = outlet) and cross sectional (0 ft., 5 ft., 20 ft.) transects.
Figure 3. Bulk density values along cross sectional transects of CFPs.
DeleteEdit embedded media in the Files Tab and re-insert as needed.
Table 2. Mapped soil series from NRCS Web Soil Survey alongside average values obtained from laboratory bulk density and particle size distribution using hydrometer method.
CFP | Soil Series
(NRCS Web Soil Survey) | Sand % | Silt % | Clay % | Bulk Density (g/cm3) |
3 | Hosmer | 7.3 | 67.5 | 25.2 | 1.45 |
5 | Hosmer, Belknap | 9 | 62.3 | 28.7 | 1.39 |
6 | Hosmer | 10.6 | 66.4 | 26.7 | 1.47 |
13 | Hosmer | 6.9 | 71.6 | 20.4 | 1.35 |
15 | Hosmer, Belknap, Stoy | 8.1 | 69.5 | 19.9 | 1.45 |
Yield data obtained from John Deere Operations Center shows poor yields in CFP areas and CFP adjacent areas. Figure 4 displays two soybean fields and their corresponding yield map for the 2025 season.
Figure 4. CFPs influence on 2025 soybean yield in bushels/acre, visualized by John Deere Operations Center.